
News
Hardware Costs Are Rising in a U.S. Price Index. What Does That Mean for Your AI Budget?
A U.S. computer and electronics price proxy rose 12.9% year over year in September 2026. See the history, scenario assumptions and practical budget checks.
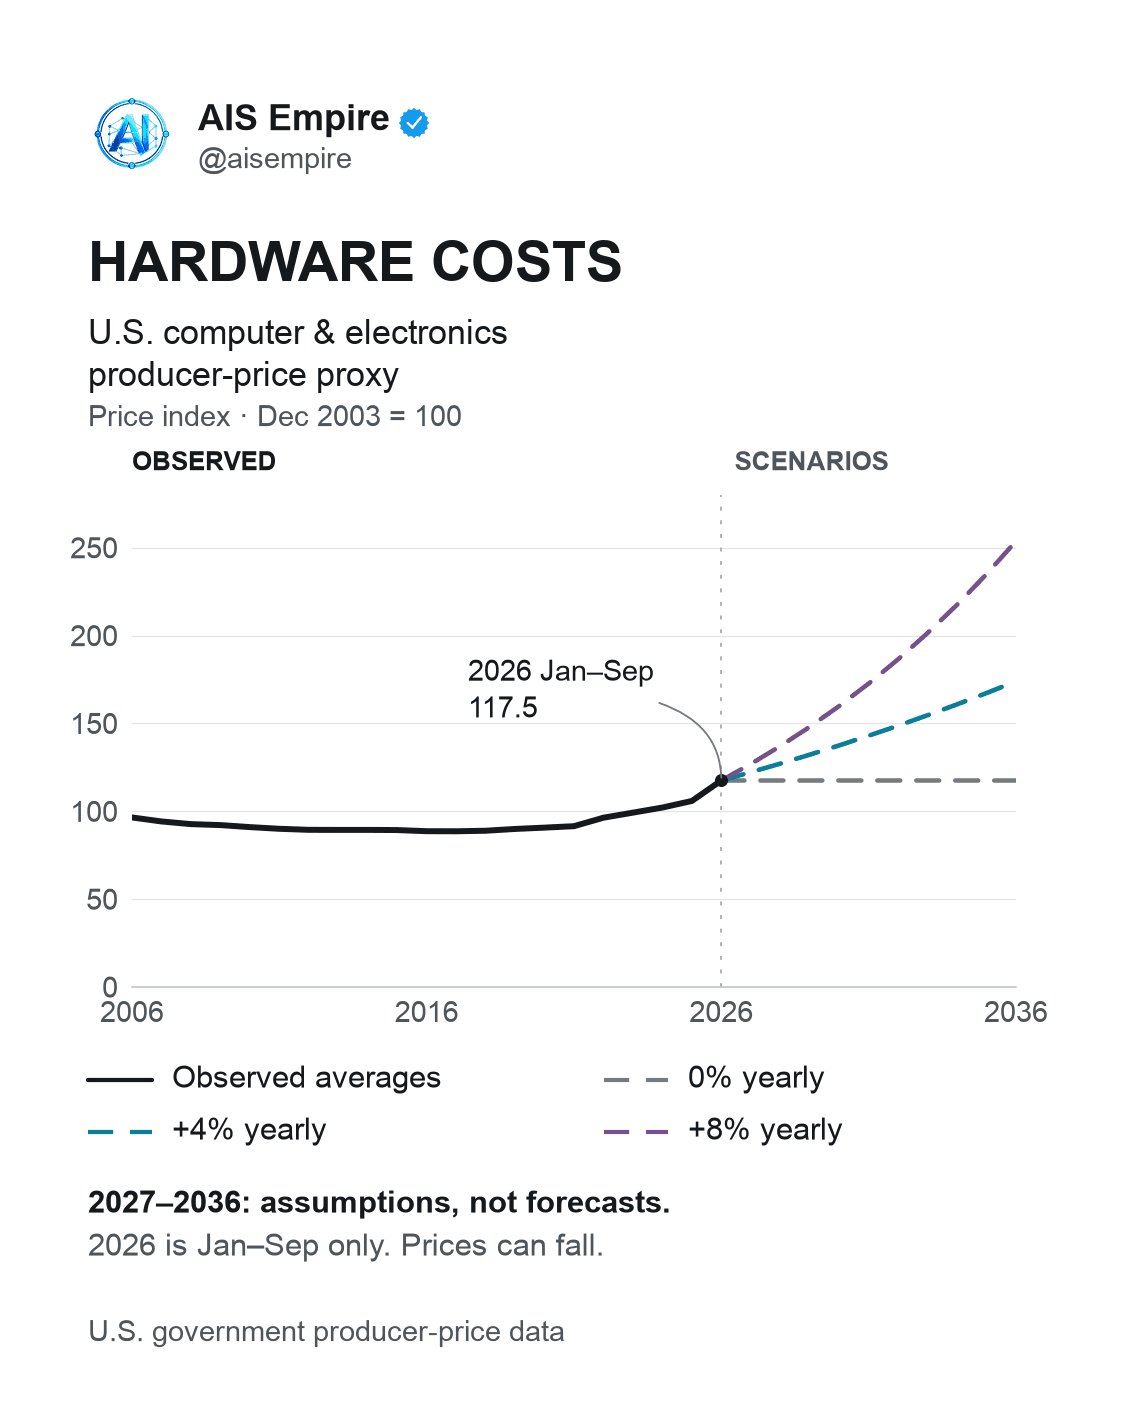
The U.S. producer-price index for computer and electronic product manufacturing was 12.9% higher in September 2026 than a year earlier. That is a reason to check the assumptions behind a technology budget—not proof that every device, supplier or country faces the same increase.
AIS Dispatch uses this broad industry series as a hardware-cost proxy. The chart combines observed history with transparent planning scenarios so business owners can discuss uncertainty without presenting guesses as measured prices.
What this hardware-cost proxy includes—and does not
The series is PCU334334: Producer Price Index by Industry: Computer and Electronic Product Manufacturing. It measures prices received by U.S. domestic producers, is not seasonally adjusted and uses December 2003 = 100. It is not a global index of all hardware, a retail basket or a quote for your next server.
Producer prices are measured from the seller’s perspective. Taxes, distribution, imports and the configuration you buy can make your actual bill different. The industry also covers more than AI chips, so the series cannot establish how much of its movement was caused by AI demand.
Long-run comparisons involve changing products and quality adjustments. The index does not price an unchanged 2006 computer sitting on a shelf today. Use it to understand a defined market measure, then obtain current quotes for the equipment or service you actually need.
Read the observed history correctly
AIS calculated 20 complete annual averages for 2006–2025 from the monthly observations. The average was 96.483 in 2006, fell to 88.625 in 2017 and reached 105.867 in 2025. The record does not show an uninterrupted 20-year rise.
The 2026 point is the January–September average: 117.535 across nine observations, not a full-year result. The September reading was 120.218 versus 106.487 in September 2025. Calculating (120.218 ÷ 106.487 − 1) × 100 gives 12.8945%, rounded to 12.9%. This is a September year-over-year comparison, not the change between annual averages.
The chart uses the data available for this November 3, 2026 publication. Government series may be revised; a later release can change the latest values and the calculations based on them.
The next ten years are scenarios, not a forecast
The dashed lines start from the unrounded 2026 year-to-date average of 117.534555556. For each year from 2027 through 2036, the calculation is 117.534555556 × (1 + r)^(year − 2026), where r is an assumed annual change of 0%, 4% or 8%.
These rates are deliberately chosen planning assumptions. They are not government or analyst forecasts, fitted predictions, probability ranges or confidence bounds. Actual prices could fall or rise outside all three paths. The anchor is a partial-year observation, not an estimate of the final 2026 average.
In 2036, those assumptions produce index levels of approximately 117.535, 173.980 and 253.748. The point is to ask whether a plan remains workable under different costs—not to claim that the middle line is the most likely outcome.
AIS analysis: Budget around the workload
Before buying equipment, define one workload and the conditions it must meet. Specify the volume, response time, privacy requirements and acceptable output quality. Compare a managed AI service, rented infrastructure and owned equipment against that same job; sticker prices alone are not comparable.
For each option, include setup, software, energy where relevant, maintenance, support and the staff time needed to operate it. Ask when a quote expires, what usage limits apply and what happens if demand changes. A cheaper purchase can still be a poor fit if it adds a maintenance burden the team cannot support.
Check the bottleneck before the purchase
If inquiries go unanswered, information is duplicated or nobody owns the next step, new hardware may not address the underlying problem. Map the handoff first. Then test whether the proposed system makes that specific step more reliable.
Benchmark now and plan resources deliberately. Rising prices can make waiting more expensive, but they do not make every purchase urgent or worthwhile. A useful partner should help you compare requirements, current quotes and operating responsibilities before you commit.
Sources and reporting
AIS Empire’s coverage draws on the original reporting and statements below.
- PCU334334 — Computer and Electronic Product Manufacturing producer-price index
Monthly U.S. industry PPI, not seasonally adjusted, December 2003 = 100. Observations through September 2026; AIS calculations use the downloaded series, not a global retail-hardware composite.
- PCU334334 — downloadable monthly observations
Reproducible input: arithmetic mean of the 12 monthly readings for each complete year 2006–2025; mean of nine readings for January–September 2026. The live download can include later revisions.
- Producer Price Index overview
Explains the domestic-producer, seller-price perspective and industry classification. This is not the same measure as the prices a retail customer pays.
- Hedonic models and quality adjustment in the Producer Price Index
Explains how product characteristics and quality changes can affect price measurement, including computer characteristics. Historical index values should not be interpreted as quotes for an unchanged device.